The T4 Ceiling: Why Vanilla VLMs Fail on Video
The Anatomy of a Crash: Why Video AI Models Explode Your GPU Memory
If you've ever tried running a large AI model on a consumer GPU, you know how it ends. The terminal hangs, an ugly red wall of text appears, and somewhere in that mess you see: CUDA out of memory.
I wanted to run Qwen2-VL-2B — a model that can watch videos and answer questions about them — on a free Colab T4. I knew it was going to crash. That wasn't the interesting part. The interesting part was figuring out exactly when, exactly how fast, and exactly which line of code pulled the trigger.
Here's the full autopsy.
Quick glossary before we dive in
VLM (Vision-Language Model): An AI that processes both images/video and text. Qwen2-VL-2B is one — the 2B means 2 billion parameters.
VRAM: The GPU's working memory. Think of it as a kitchen counter — 15 square feet of workspace. Every ingredient you pull out takes up space. Run out of counter and everything crashes to the floor.
Tokens: AI doesn't see pixels or read words. It converts everything — text, images, video frames — into numerical chunks called tokens. A sentence might be 50 tokens. A single video frame might be hundreds.
Prefill vs. Decoding: When you ask the model a question about a video, it works in two phases. Prefill is reading — the model ingests the entire video and prompt at once. Decoding is writing — it generates the answer one token at a time.
KV Cache: During decoding, the model needs a notepad to remember what it already processed so it doesn't re-read the entire video for every word it generates. That notepad lives in VRAM.
The setup
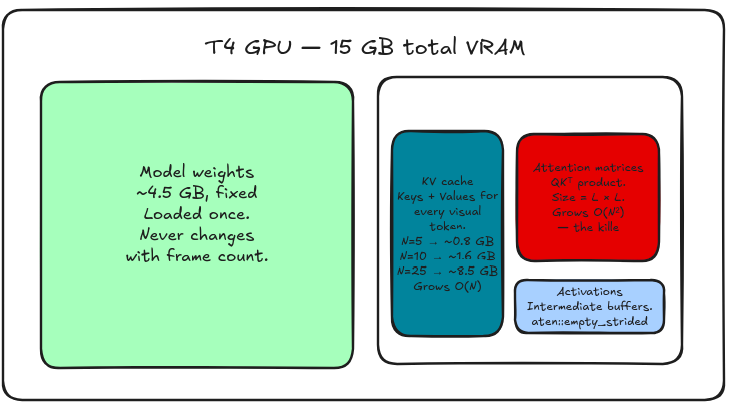
Model: Qwen2-VL-2B-Instruct fp16. Hardware: T4, 15 GB VRAM. One fixed 720p, 59-second video clip. Same prompt every run: "Describe what is happening in this video."
The model weights alone consume ~4.5 GB. That leaves about 10.5 GB for everything else — the KV cache, attention matrices, intermediate buffers. The plan was to sweep frame counts from N=5 to N=30, record peak VRAM at each step, and let it crash.
The first surprise: the secret downscale
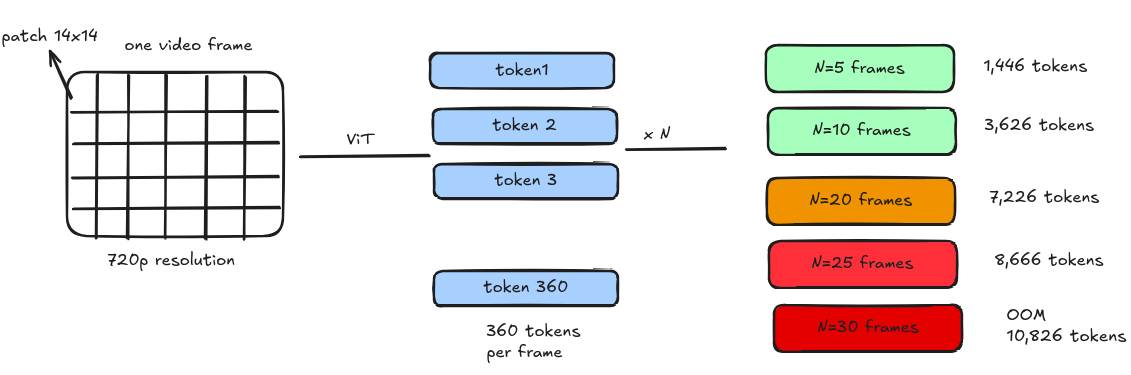
I fed it a 720p video. 1280×720 = 921,600 pixels per frame. At that resolution, the model would have generated thousands of tokens per frame and crashed immediately on the first test. It didn't crash. The tokenizer dry-run showed only 360 visual tokens per frame.
What happened? The preprocessing pipeline quietly saved my life. It looked at the 720p input, decided it would destroy the GPU, and downsampled the frames to roughly 282,000 pixels before the model ever saw them.
This is actually by design. Qwen2-VL has a hard ceiling of 729 tokens per frame, regardless of input resolution. Here's where that number comes from:
The ViT (Vision Transformer) divides images into 14×14 pixel patches Maximum grid size is 448×448 pixels → that's a 32×32 patch grid 32×32 = 1,024 patches, which get merged down to ~729 tokens
Because my video is wide but not very tall, the aspect ratio compression landed at 360 tokens/frame rather than the 729 ceiling. That became the baseline.
The sweep: watching memory explode
With the token density confirmed, I ran the full sweep:
| Frames | Total Tokens | Peak VRAM | Delta |
|---|---|---|---|
| 5 | 1,466 | 4.58 GB | — |
| 10 | 3,626 | 5.94 GB | +1.36 GB |
| 15 | 5,066 | 7.40 GB | +1.46 GB |
| 20 | 7,226 | 10.42 GB | +3.02 GB |
| 25 | 8,666 | 12.99 GB | +2.57 GB |
| 30 | 10,826 | OOM | — |
The delta column is where things get interesting. Going from 5→10 frames costs 1.36 GB. Going from 15→20 frames costs 3.02 GB. Same five frames added, more than double the VRAM cost. That's not a coincidence.
Why the cost keeps accelerating: the dinner party problem
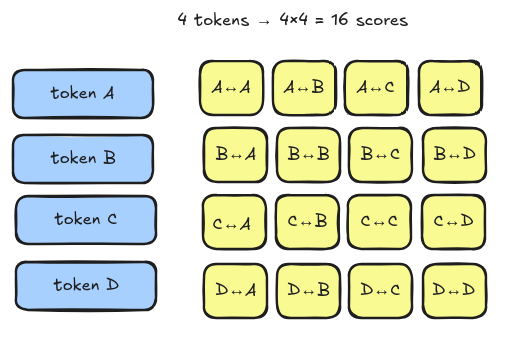
Standard self-attention computes a relationship score between every token and every other token. That's an L×L matrix where L is sequence length.
Think of it like a dinner party where every guest shakes hands with every other guest. 10 guests = 45 handshakes. Double to 20 guests and you don't get 90 handshakes — you get 190. The math scales as O(L²): when the guest count doubles, the handshakes roughly quadruple. At N=10 I had L≈3,626 tokens. At N=20 I had L≈7,226 — roughly double. The attention matrix didn't double. It nearly quadrupled. That's exactly what the delta jump from +1.36 GB to +3.02 GB is showing. By N=30, L≈10,826. The dinner party got too big. The kitchen counter collapsed.
The autopsy: what actually killed it
Knowing when it crashed wasn't enough. I hooked torch.profiler into the N=10 run and sorted by cumulative CUDA memory allocation to find exactly which operations were responsible.
Two distinct culprits showed up.
Culprit 1 — The attention matrix (aten::bmm + aten::_softmax)
These two ops accumulated over 33 GB of memory allocation across the forward pass. On a 15 GB card. That sounds impossible until you understand the difference between cumulative and peak allocation. The model has 32 attention layers. Each layer builds a massive L×L score matrix, uses it, then frees it before the next layer runs. So 33 GB cumulative doesn't mean 33 GB resident simultaneously — it means the same memory got allocated and freed repeatedly across all 32 layers.
Going a bit in depth here: First, what even is attention? Before the diagram, you need this mental model: Every token needs to ask every other token "hey, how relevant are you to me?" That question-and-answer process produces a score. Those scores fill a grid — one row per token asking, one column per token being asked. That grid is the attention matrix. It lives in VRAM.
The key insight - The model has 32 layers. Each layer builds this grid, uses it, then deletes it. That's why profiler shows 33 GB cumulative but only ~6 GB peak — same memory reused 32 times. But at N=30, one single layer's grid = 7.4 GB. Doesn't fit.
So the attention matrix isn't one big thing sitting in memory the whole time. It's a temporary grid that gets built, used, and deleted — 32 times, once per layer. The profiler's 33 GB is the sum of all those temporary grids, not the peak. But at N=30, even one grid is too large to fit. That's the actual crash.
But here's the actual problem: at N=30, just one of those per-layer matrices became larger than the entire 15 GB card. Not the sum, a single layer's attention matrix exceeded VRAM capacity. That's when it stopped being a cumulative accounting story and became a hard physics problem.
Culprit 2 — The copy-on-append KV cache (aten::empty_strided + aten::cat)
These two ops accumulated over 24 GB.
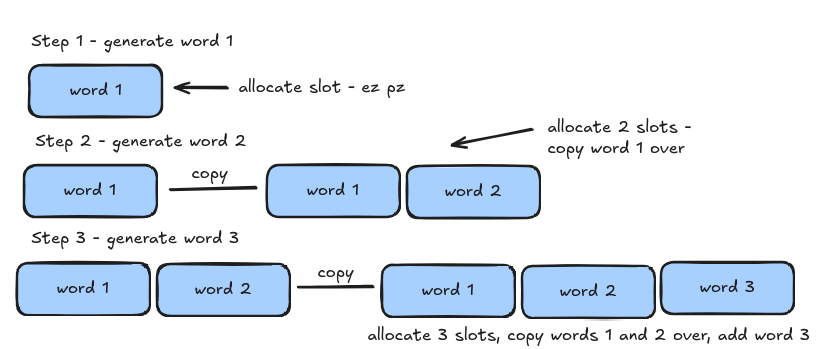
Every time the model generates a new token during decoding, it needs to append new Key and Value vectors to the cache. HuggingFace does this by concatenating, it allocates a brand new buffer large enough for the old cache plus the new entry, copies everything over, then frees the old one. At sequence length L, every single decode step costs O(L) in allocation just for bookkeeping. As the sequence grows, this gets progressively more expensive.
Understand this using this diagram:
Two problems, two different fixes
The profiler finding matters because the two failure modes need two different solutions, not one.
The attention matrix problem is mathematical. You can't just allocate memory more cleverly when the matrix itself is too large. You need to either reduce the number of tokens entering the model, or process the prefill in chunks so the full L×L matrix never exists all at once. That's chunked prefill.
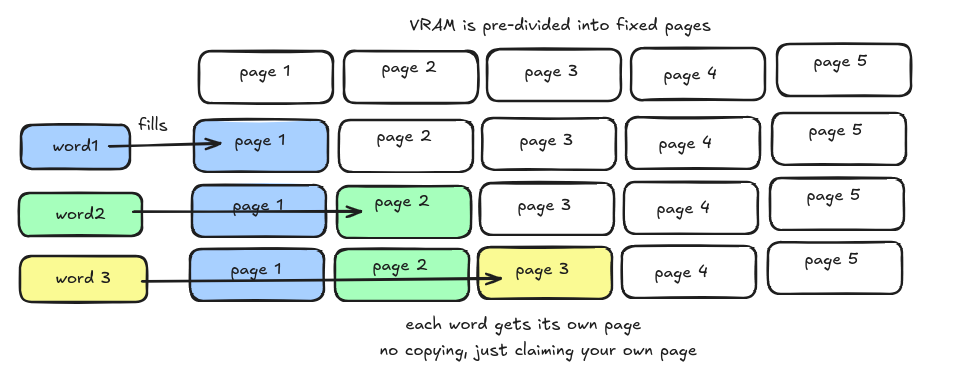
The copy-on-append problem is a pure engineering failure. PagedAttention — used by SGLang and vLLM — fixes this by breaking the KV cache into fixed-size memory pages scattered wherever free space exists. No contiguous buffer required. No copying. The cache grows by adding pages, not by duplicating itself.
What this actually tells us about video inference
The T4's 15 GB isn't unusual, most edge inference hardware sits in the 8–16 GB range. And the Qwen2-VL-2B model is genuinely small at 4.5 GB of weights. The problem isn't the model size. It's that even a small model becomes unrunnable on video because sequence length, not model size, is what kills you.
This is the core tension in video VLM inference: temporal understanding needs many frames, many frames mean long sequences, and long sequences are quadratically expensive by default. The baseline HuggingFace implementation makes no attempt to solve this. It just runs until it crashes.